
Carbon-dioxide and other gasses which result from the burning of fossil fuels accumulate in the atmosphere which in turn increases the earth’s average temperature.
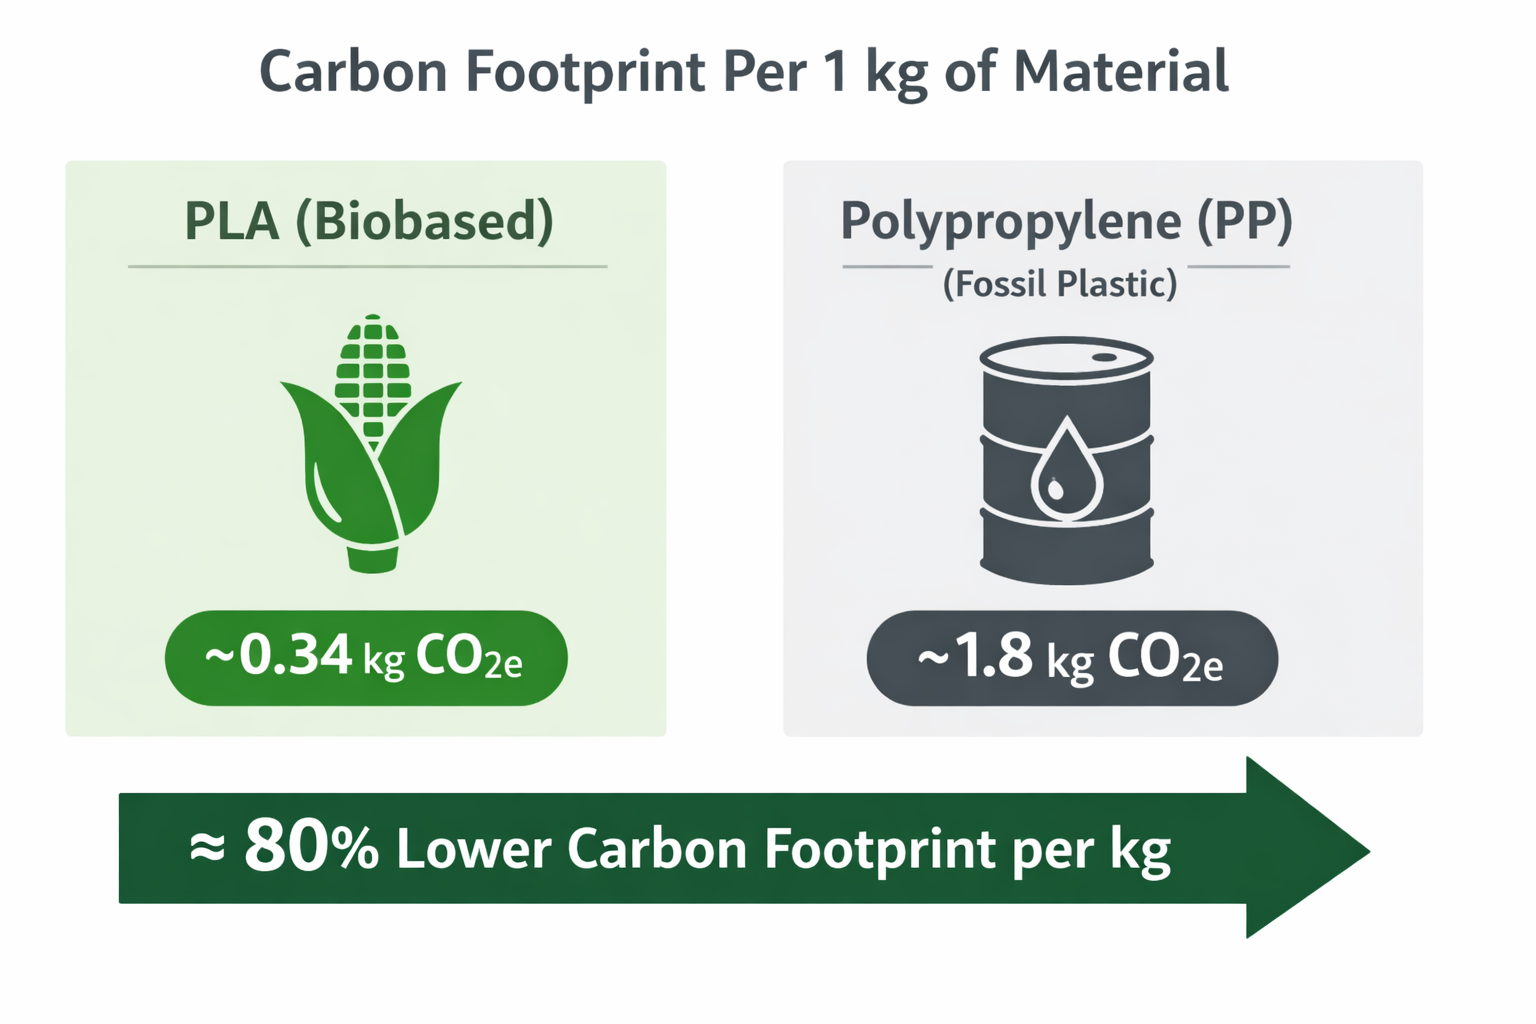
Here’s a clear comparison of the material footprint per 1 kg of material for PLA vs polypropylene (PP):
Material CO₂e per 1 kgPLA (biobased)~0.34 kg
CO₂e Polypropylene (fossil plastic)~1.8 kg CO₂e
Material: 0.15 kg
Manufacturing: 0.12 kg
Transportation: 0,03kg
End of Life: 0.00 kg
0.34 kg
CO2e

Sulfur dioxide, nitrous oxides other acidic emissions to air cause an increase in the acidity of rainwater, which in turn acidifies lakes and soil. These acids can make the land and water toxic for plants and aquatic life.
Material: 0.213 kg
Manufacturing: 0.059 kg
Transportation: 8.4E-3 kg
End of Life: 0.00 kg
0.280 kg
SO2e

When an over abundance of nutrients are added to a water ecosystem, eutrophication occurs. Nitrogen and phosphorous from waste water and agricultural fertilizers causes an overabundance of algae to bloom, which then depletes the water of oxygen and results in the death of both plant and animal life.
Material: 0.053 kg
Manufacturing: 2.2E-3 kg
Transportation: 1.9E-3 kg
End of Life: 0.00 kg
0.057 kg
PO4e

A measure of the non-renewable energy sources associated with the part’s lifecycle in units of megajoules (MJ). This impact includes not only the electricity or fuels used during the product’s lifecycle, but also the upstream energy required to obtain and process these fuels, and the embodied energy of materials which would be released if burned.
Material: 2000 MJ
Manufacturing: 180 MJ
Transportation: 27 MJ
End of Life: 0.00 MJ
2200
MJ
.png)

.png)


Explore other pieces and collections in our shop. You’ll also find your nearest stockist as well as frequently asked questions.